
What a proteomic aging clock is
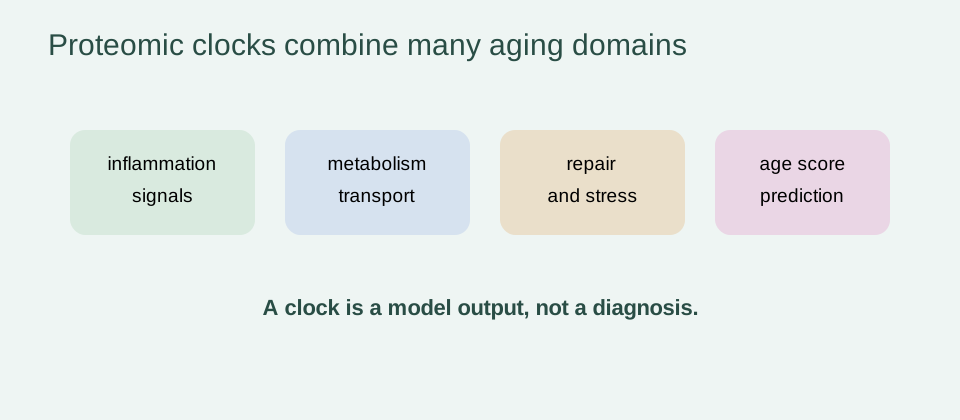
Proteomics measures proteins or protein-related signals in a biological sample. A proteomic aging clock uses many of those measurements in a statistical model trained to estimate chronological age or another age-related target. The output is often called proteomic age, and the difference between predicted and chronological age is an age gap or age acceleration measure.
The model does not read an invisible biological-age dial. It learns associations in a particular cohort, using a particular assay, preprocessing pipeline and definition of age. A high age prediction error may reflect biology, illness, medication, technical variation or a population that differs from the training data.
Proteins are attractive because they sit closer to cell activity than DNA sequence and can reflect inflammation, metabolism, tissue injury, signaling and loss of proteostasis. That proximity creates interpretability opportunities, but it also means that a clock can be sensitive to short-term physiology and disease.
Why plasma proteins are attractive aging biomarkers
Blood is comparatively accessible, repeatable and compatible with prospective cohort sampling. Circulating proteins can carry information from several tissues, including signals released during immune activation, vascular remodeling, organ stress or altered metabolism. A single sample can therefore provide a systems-level view that is difficult to obtain from one biopsy.
Plasma is not a transparent window into every organ. Concentration depends on secretion, clearance, binding, transport, blood volume and kidney or liver function. A protein associated with a tissue may be produced elsewhere, and a blood signal can be downstream of disease rather than a cause of aging.
The useful question is consequently not “which protein causes aging?” but “what information does this measured pattern add for a defined population and outcome?” A clock can rank risk or reveal pathways while remaining unsuitable for individual diagnosis.
| Output | What it captures | What it does not establish |
|---|---|---|
| Chronological-age prediction | statistical fit to age in the training population | that the person is biologically old or young |
| Age gap | departure from expected age after model adjustment | the cause of that departure |
| Disease association | relative risk or prevalence pattern in a cohort | that the clock causes disease |
| Organ-specific score | pattern enriched for a nominated tissue or system | confirmed organ pathology without clinical validation |
Mass spectrometry versus affinity-based proteomic platforms
Mass spectrometry separates and identifies peptides or proteins by their physical properties and can support broad discovery with careful quantification. Affinity-based platforms use binders such as antibodies or aptamers to measure selected targets at scale. Both can be powerful, but their measurements are not automatically interchangeable.
Platform choice affects dynamic range, detection limits, missingness, cross-reactivity, calibration and the set of proteins that can be measured reliably. Even when two platforms use the same protein name, they may detect different isoforms, fragments or epitopes. Model coefficients learned on one platform should not be copied to another without analytical and external validation.
In the 2025 organ-specific clock study, plasma profiling used the Olink Explore 3072 panel and measured 2,916 proteins in the analyzed cohorts. That detail is part of the result, not a footnote: the reported accuracy belongs to that assay context and its normalization procedures.
How machine-learning age models are trained
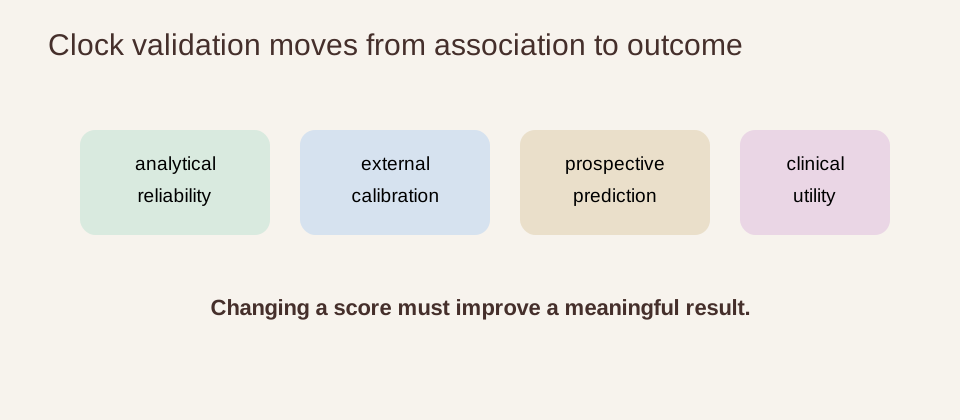
A typical pipeline defines a target age, splits participants into training and test sets, preprocesses the protein matrix, selects features and fits a predictive model. The test set must remain separate from feature selection and tuning. External validation in a distinct cohort is stronger still because it tests transport beyond the discovery workflow.
Model performance is often reported as correlation, mean absolute error or calibration. A high correlation means that people with higher predicted age tend to have higher chronological age; it does not tell us whether the residual age gap predicts a preventable outcome or responds to treatment.
Feature selection can make a model smaller and easier to assay, but parsimony does not by itself improve causal interpretation. A protein may be predictive because it tracks age, blood-cell composition, kidney function or an unmeasured exposure. The most informative papers report the cohort, platform, feature count, validation design and adjustment set.
Chronological-age prediction versus disease-risk prediction
Predicting chronological age and predicting disease are related but different tasks. An age model can perform well while adding little information about dementia, kidney disease or mortality. Conversely, a disease-risk model may use proteins that are clinically useful without accurately estimating age.
Age acceleration is usually a residual: predicted age is regressed against chronological age, and the remaining difference is analyzed. The residual depends on the regression population and covariates. Re-estimating it in another population can change its scale and meaning.
When an accelerated score is associated with mortality, the result is prognostic association. It may reflect subclinical disease, frailty, inflammation, socioeconomic exposure or treatment patterns. Longitudinal design and extensive adjustment reduce some explanations, but association remains distinct from a causal aging rate.
Proteomic age acceleration and large-cohort clocks
The 2025 Nature Aging organ-specific study developed an organismal clock and ten organ-specific clocks in 43,616 UK Biobank participants. It validated the models in the China Kadoorie Biobank, with 3,977 participants, and the US Nurses’ Health Study, with 800 participants. The reported cross-cohort correlations were 0.98 and 0.93, showing strong transport in those datasets and assay conditions.
The models used tissue-enrichment information and machine learning. Of the 2,916 measured proteins, 418 were annotated as enriched in at least one of ten organs or systems. The organismal model used 240 age-related proteins, while organ-specific models ranged from 5 proteins for the heart to 76 for the immune system.
Those numbers describe an important advance in scale and validation, not a consumer test. The study’s disease and mortality analyses were cohort associations, and the models still require prospective clinical validation, platform harmonization and proof that a score can guide a beneficial decision.
Brain, artery, kidney, liver and immune-system signals
Organ-specific models ask whether a circulating pattern is more strongly aligned with one tissue or system than with a whole-body average. In the 2025 study, brain age showed the strongest association with mortality, while kidney and intestine scores were strongly associated with chronic kidney disease and type 2 diabetes. The reported patterns were adjusted for several demographic and lifestyle factors and replicated in external cohorts.
These associations are biologically coherent without being diagnostic. A brain score may reflect vascular, synaptic, glial or systemic influences; a kidney score may be affected by filtration and metabolic state; an immune score may reflect infection history or inflammation. The score should prompt a research question or a clinically appropriate evaluation, not substitute for one.
Organ scores are also correlated to varying degrees. Partial independence can be informative, but it does not mean that organs age in isolation. Multiorgan disease, shared exposures and common circulation create a network that a single organ label can oversimplify.
Multi-tissue proteomic atlases and age inflection points
Multi-tissue atlases add a different kind of evidence. They compare protein abundance or composition across tissues and ages, helping identify when pathways change and whether trajectories are shared or tissue-specific. A 2025 Cell study of human proteome profiles across a 50-year lifespan is useful in this role: an atlas can map biology and generate candidate clocks, even when it is not a prospective intervention trial.
Age inflection points should be interpreted cautiously. A curve can bend because of sampling, cohort composition, survivor bias, hormonal transition, disease accumulation or a genuine change in biology. The age at which a protein changes in a cross-sectional atlas is not automatically the age at which an intervention should begin.
Longitudinal sampling is better suited to individual trajectories, but it remains sensitive to assay drift, changing health, medication and regression to the mean. Repeated measures, independent cohorts and functional endpoints are needed to distinguish a stable trajectory from a noisy snapshot.
How organ-specific proteins are assigned
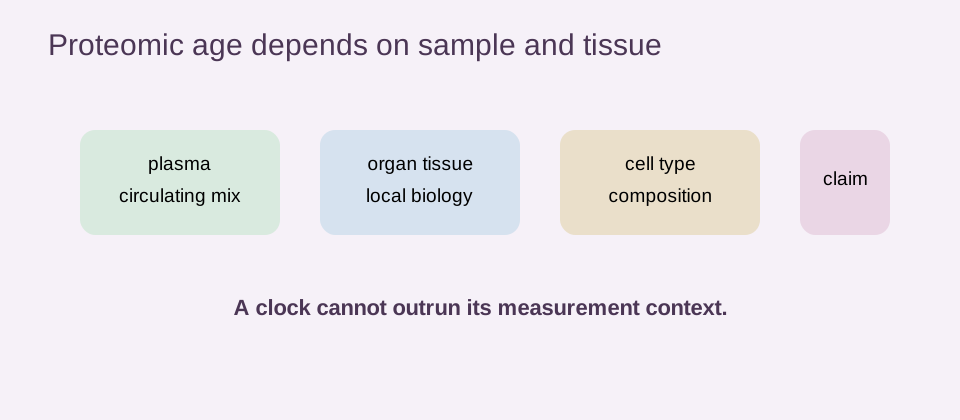
Organ enrichment is usually inferred by comparing tissue expression references with circulating measurements. In the Nature Aging study, GTEx tissue-level expression data helped annotate proteins as enriched in one or more major organs or systems. This is a useful bridge between plasma and tissue biology, but enrichment is probabilistic rather than proof of exclusive tissue origin.
Protein abundance can reflect secretion from multiple sites, leakage after injury, altered clearance or a systemic response. A protein assigned to the brain-enriched set is therefore not a direct biopsy of the brain. The more distant the output is from a clinical endpoint, the more carefully the claim must be bounded.
Interpretability improves when a clock is accompanied by pathway analysis, genetic context, imaging or independent tissue evidence. It does not mean every selected protein is causal or that the model can identify the location of pathology in an individual.
Comparison with DNA-methylation clocks
DNA-methylation clocks measure chemical marks on DNA, while proteomic clocks measure proteins or protein signals. Methylation can provide a relatively stable regulatory record; proteins are closer to current physiology and may respond more quickly to inflammation, metabolism or organ stress. Neither layer is a universal biological-age truth.
Different clocks can disagree because they sample different biology, tissues, time scales and technical error. Agreement may strengthen confidence that a shared signal exists, but disagreement is not automatically evidence that one clock is wrong. The important test is whether the chosen measure predicts or explains a specified outcome in the population of interest.
The epigenetic-aging page and biological-age testing page provide the wider comparison. A biomarker panel should be selected for the decision and endpoint, not because its output is labeled “younger.”
Advantages: mechanistic interpretability and pathway mapping
Proteins can be connected to signaling pathways, cell types, metabolism and organ biology more directly than a purely statistical score. Organ-enriched clocks can organize hypotheses about vascular, brain, kidney, immune or liver aging. Genetic instruments, imaging and experimental perturbation can then test whether an association is likely to be causal.
Proteomic data can also support multiplexed monitoring. The same sample may be used to examine inflammation, extracellular matrix turnover, lipid transport, neurobiology and immune signaling. That breadth is valuable for discovery and for evaluating whether a proposed intervention changes several related pathways.
Interpretability is a gradient, not a guarantee. A plausible pathway can be a downstream response, and a protein that improves prediction can be redundant with another marker. Biological explanation should be tested independently of the model’s feature ranking.
Limitations: platform drift, batch effects and confounding
Proteomic studies must manage pre-analytical handling, storage, plate effects, calibration, batch correction and missing measurements. A model can appear to transport because technical differences are small in the validation cohort, then fail when a laboratory changes reagents or instrument settings.
Population transport is equally important. Age range, ancestry, sex distribution, medication, disease burden, socioeconomic exposure and recruitment design can alter protein distributions. A model trained on volunteers with relatively good health may behave differently in people with multimorbidity or in a clinical laboratory.
Confounding and reverse causality remain central. Disease can accelerate the score, and the score may then be interpreted as evidence that aging caused the disease. Adjustment helps but does not recreate a randomized experiment. Transparent reporting of exclusions, missingness, calibration and competing risks is essential.
| Test | Question | Failure signal |
|---|---|---|
| Analytical | does the assay reproduce the signal? | batch or platform drift |
| Population | does calibration hold in the intended group? | systematic age-gap bias |
| Clinical | does the score add decision value? | association without useful reclassification |
Can interventions move proteomic age?
Proteomic measurements can change after an intervention, but responsiveness is not the same as validated rejuvenation. A change might represent altered inflammation, fluid balance, medication exposure, weight, exercise, acute illness or assay noise. The intervention must be named, the platform specified and the timing prespecified.
A convincing intervention study would include randomization where feasible, a control group, repeated measurements, a prespecified clock, clinical or functional outcomes and enough follow-up to assess durability. It should show that the observed protein change is reproducible and that any benefit is not offset by infection, cancer, organ toxicity or other harms.
The longevity clinical trials page explains why a biomarker can be a useful secondary endpoint without being a surrogate for survival. Until that chain is validated, a moved proteomic age score is a research observation.
Evidence verdict and future clinical validation
Proteomic aging clocks have moved beyond simple proof-of-concept age prediction. Large human cohorts, external validation and organ-enriched models show that plasma protein patterns can carry information about chronological age, organ-related disease and mortality. Multi-tissue atlases add biological context and help identify tissue-specific trajectories.
The boundaries are just as important. Platform dependence, batch effects, disease confounding, population transport, model recalibration and the distance between a blood score and organ function all limit interpretation. A proteomic age gap is not a diagnosis, and an organ-age estimate is not proof of organ pathology.
The responsible conclusion is proteomic clocks are promising research biomarkers, not established anti-aging treatments or clinical aging tests. The next validation step is not another attractive correlation. It is a reproducible, prospectively tested link from a specified platform and score to a decision that improves a meaningful human outcome.
- name the platform, cohort and model target;
- separate chronological-age prediction from disease-risk association;
- treat organ assignment as evidence-weighted context, not a diagnosis;
- test calibration and transport in the intended population;
- require intervention and clinical-endpoint evidence before claiming rejuvenation.