Scope: This review examines one computational-pathology paper and related structural-aging research. It is not a guide to consumer testing, elective biopsy or medical decision-making.
What the 2026 tissue study measured
Abila and colleagues analyzed 25,712 whole-slide histopathology images from 40 tissue types spanning 29 organs in 983 Genotype-Tissue Expression (GTEx) donors. Tissue was collected after death through a rapid-autopsy protocol; this was a cross-sectional resource, not serial biopsy sampling of living people. The image count therefore describes slides, not independent participants or repeated measurements of one person.
There is a count discrepancy in the source itself: the PubMed record and the Nature Medicine abstract report 25,712 images, while the Results section reports 25,713. This article follows the abstract and PubMed denominator. Neither number is a participant count. A donor could contribute several tissue types and slides, and image patches are smaller units nested within slides. Analyses of telomeres, gene expression, methylation and pathology annotations also used different matched subsets, so their denominators should not be substituted for the full donor cohort.
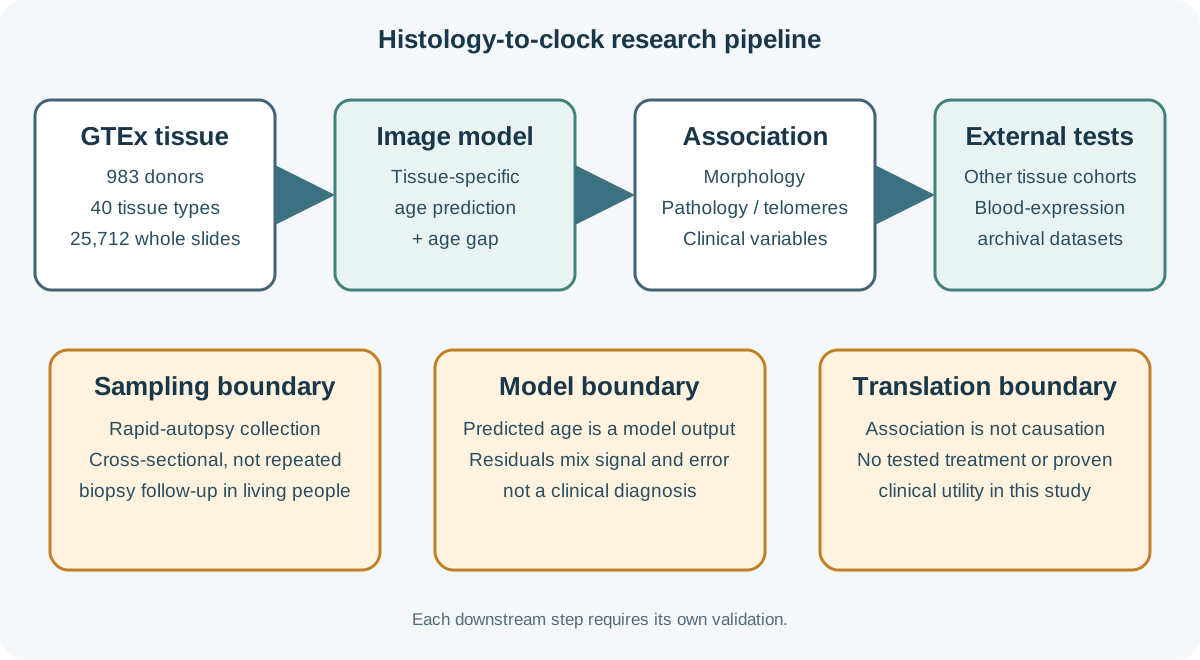
A tissue clock is a prediction rule, not a direct age reading
A tissue clock in this paper is a model trained to predict chronological age from histological images. The difference between predicted and chronological age is an age gap. It can be studied as a research phenotype, but it is not a direct measure of a single aging mechanism. Models can use image patterns that covary with age without identifying whether those patterns are causes, consequences, disease effects, tissue-composition changes or technical artifacts.
Histology, DNA-methylation clocks and circulating-protein clocks measure different features. A disagreement between them is not automatically a failure: the modalities may capture partly distinct biology and use different samples, labels and statistical targets. In the GTEx comparison, histology-derived and methylation-derived age gaps did not directly correlate, while both showed selected associations with biological features. The authors note technical differences in tissue-block matching and limited variation in the mostly non-diseased cohort as possible explanations. The relevant test is whether each score is reproducible and adds useful information for a defined outcome.
| Approach | Input and target | Interpretation limit |
|---|---|---|
| Chronological age | Elapsed calendar time | Does not describe tissue condition by itself. |
| Histology tissue clock | Image morphology used to predict age in a tissue | Residual age gap is model-dependent and not a diagnosis. |
| Molecular clock | DNA methylation, proteins or other assays | Not interchangeable with a morphology-derived score without direct comparison. |
| PathStAR trajectory | Structural change across age windows without age-prediction training | Different method and question; not a head-to-head validation of the tissue clocks. |
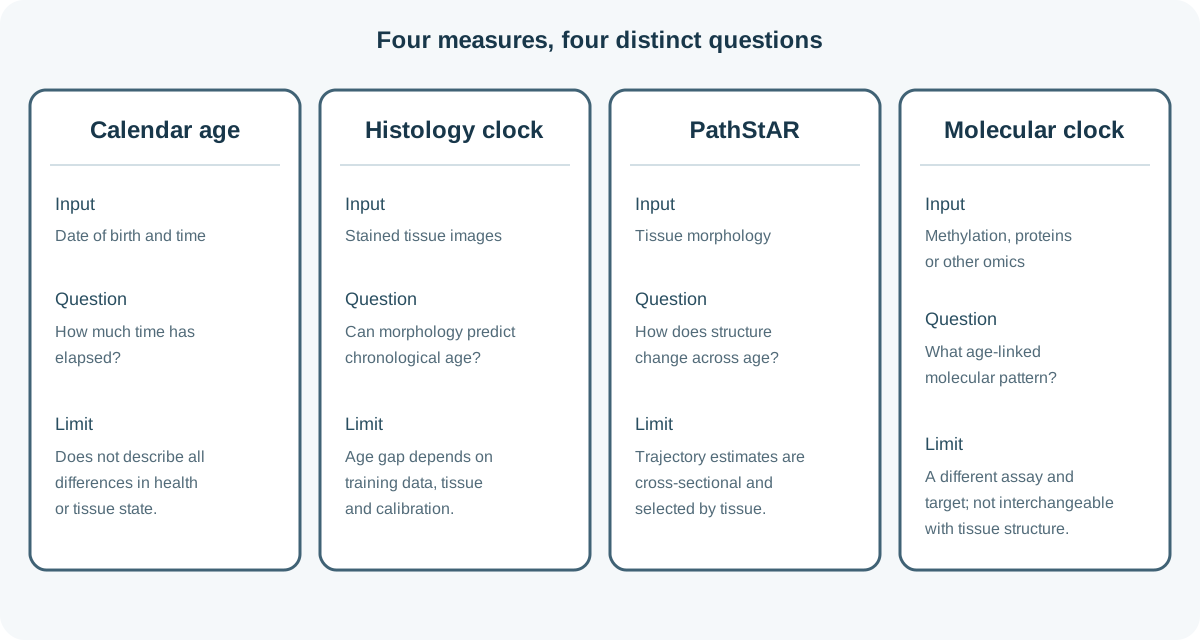
What the models found across tissues
Across tissue clocks, the authors reported a mean absolute age-prediction error of 4.88 years and an average coefficient of determination of 0.69. Those are aggregate model-performance statistics, not a guaranteed error range for every tissue or a personal confidence interval. Four of the 40 tissue models had fewer than 100 samples, and sample availability varied by tissue.
For 6,197 samples with telomere-length measurements, the team examined relationships between tissue age gaps and telomere length. Age gaps also showed associations with subclinical pathology and comorbidity measures. The study described broad patterns as exploratory; these cross-sectional associations cannot establish that a tissue-age score causes disease or that changing the score would change health.
In external histology cohorts, GTEx-trained clocks were evaluated in brain samples from 70 people, lung from 40 and skin from 185. The reported correlations between predicted and chronological age were 0.56, 0.76 and 0.46, respectively. This is a useful generalization test, but the cohorts were modest in size and performance varied. Differences in staining, scanners, tissue handling and participant mix can shift image data and calibration.
The external analysis also compared clocks applied to matching and nonmatching tissues and assessed bias, limits of agreement and calibration slopes, rather than relying on correlation alone. Tissue-matched clocks performed better across those calibration measures, while slopes below 1 indicated compressed predictions under cohort shift. Several regression families generalized comparably, but neural-network regressors performed worse in the external cohorts. That result is a reminder that model complexity does not guarantee transportability; an apparently accurate model can still need recalibration and may fail when slides come from a different institution, scanner or donor population.
What the blood-expression analysis can and cannot show
The study linked blood gene-expression profiles to image-derived tissue age gaps in GTEx, then applied the trained models to independent archival blood-expression cohorts. The validation set included 1,205 samples across nine cohorts: 577 classified as healthy and 628 associated with seven chronic diseases, with stroke analyzed as an acute-event comparison. Researchers reported disease-associated patterns, including higher brain age-gap estimates in stroke and gastrointestinal estimates in Crohn’s disease.
This is evidence that blood-expression patterns can be used to estimate a model target built from tissue images in these datasets. It is not direct measurement of tissue age from blood, and the case-control associations do not establish that the score predicts future disease. The paper notes that absolute calibration cannot be verified in external cohorts without paired tissue histology. The underlying associations between gene expression and image-derived gaps were explored in more than 17,000 matched bulk RNA-sequencing samples; that large discovery resource is distinct from the 1,205 archival samples used for external blood-model comparisons.
The disease datasets were assembled from multiple sources and clinical contexts rather than a single prospective screening cohort. A model that separates existing case groups may reflect disease, treatment, comorbidity, sampling or technical differences. Prospective cohorts with blood collected before disease onset, fixed assays, representative populations and pre-specified clinical outcomes would be needed to test prediction and utility.
Related structural-aging work is complementary, not replication
A separate 2026 Nature Aging paper by Yadav and colleagues applied PathStAR to 25,306 post-mortem biopsy slides from 970 GTEx donors across 40 tissue types. Instead of training an age predictor, the method estimated population structural-change trajectories across age windows and individual deviations from those trajectories.
PathStAR compares morphology across neighboring age windows, estimates population-level rates of structural change and scores deviations from those trajectories. It identified high-confidence trajectories in 15 tissues, including earlier acceleration in some vascular tissues, later changes in uterus and vagina around the menopause years, and biphasic patterns in some digestive and male reproductive tissues. These are population patterns across cross-sectional age bands, not within-person follow-up or proof that structural change causes functional decline. Unlike the Nature Medicine model, PathStAR was not trained to predict chronological age.
Both papers draw on GTEx and image morphology, but their targets and methods differ. The second analysis adds another way to describe tissue structure; the shared source project means it is not a fully independent replication of the first study. Neither paper establishes an actionable clinical score for an individual.
Sampling, model limits and commercial disclosures matter
GTEx was designed as a tissue-expression resource, not as a prospective clinical aging study. The main cohort used post-mortem samples from ages 20 to 70, and the paper reports a female-to-male ratio of about 1:2. Tissue selection, availability, autolysis timing, subclinical disease and donor characteristics can affect what the models learn. A model trained on one sample and scanner pathway may not calibrate on another hospital’s slides.
Age prediction is also not causal explanation. If age is the training label, models are optimized to recover patterns associated with age in the available data. A residual may combine biological variation, disease, exposures, measurement error and cohort structure. Group associations do not show that a score can reliably classify one person’s health or response to treatment.
Image processing and model choice matter. Slides were divided into tissue patches, image features were extracted and regression models predicted age within tissue types. The reported average summarizes diverse tissue-specific models; it does not mean every organ had the same sample size or error. The authors also compared alternative image encoders and regression approaches, which is useful sensitivity analysis but does not remove the need for external calibration on new scanners and populations.
Across several tissues, image-language analyses highlighted age-associated patterns such as atrophy, microvascular rarefaction and fibrosis. These are recognizable histological features, not a single universal aging pathway. Their frequency and interpretation vary by organ, and an image-level association does not establish that one feature explains an individual’s functional decline.
For its demographic and clinical analysis, the team considered 184 variables and retained 80 that occurred often enough for tissue-specific comparisons. The paper describes associations such as respiratory disease with lung age gaps and type 2 diabetes with pancreatic age gaps; kidney failure was associated with higher inferred gaps in several tissues, not only the kidney. These patterns can generate hypotheses about organ-wide effects, but the paper labels this mapping exploratory and reports that no statistical testing was performed for the overview in its cross-tissue factor figure. The analyses cannot determine whether a condition accelerated tissue change, whether tissue state contributed to the condition, or whether treatment, sampling and correlated health factors explain part of the association.
The Nature Medicine disclosure names Ernesto Abila, Iva Buljan, Yimin Zheng and André Rendeiro as having competing financial interests in patent applications PCT/EP2025/078696 and WO/2026/074209. It also records other author relationships, including travel or speaker support, research collaborations and lecture honoraria. The related Nature Aging paper separately lists Anamika Yadav and Sanju Sinha as inventors on a US provisional patent application connected to that manuscript. These disclosures are relevant context for evaluating research and future commercialization; a patent neither validates nor invalidates a model. Independent replication, transparent validation sets and calibration reporting remain necessary.
The study also used many correlated observations: one donor could contribute several tissues, and one tissue could be represented by multiple slides and image patches. Those observations are valuable for modeling but are not interchangeable statistical units. Readers should follow the denominator for each analysis rather than applying the overall total of 983 donors or 25,712 images to every tissue-level conclusion.
The study did not test a longevity drug or lifestyle intervention, show reversal of tissue aging, or measure lifespan benefit. It does not justify an elective biopsy or consumer blood test for longevity assessment. At present, tissue-clock findings are research phenotypes. They should not guide individual medical decisions outside a properly validated clinical use.
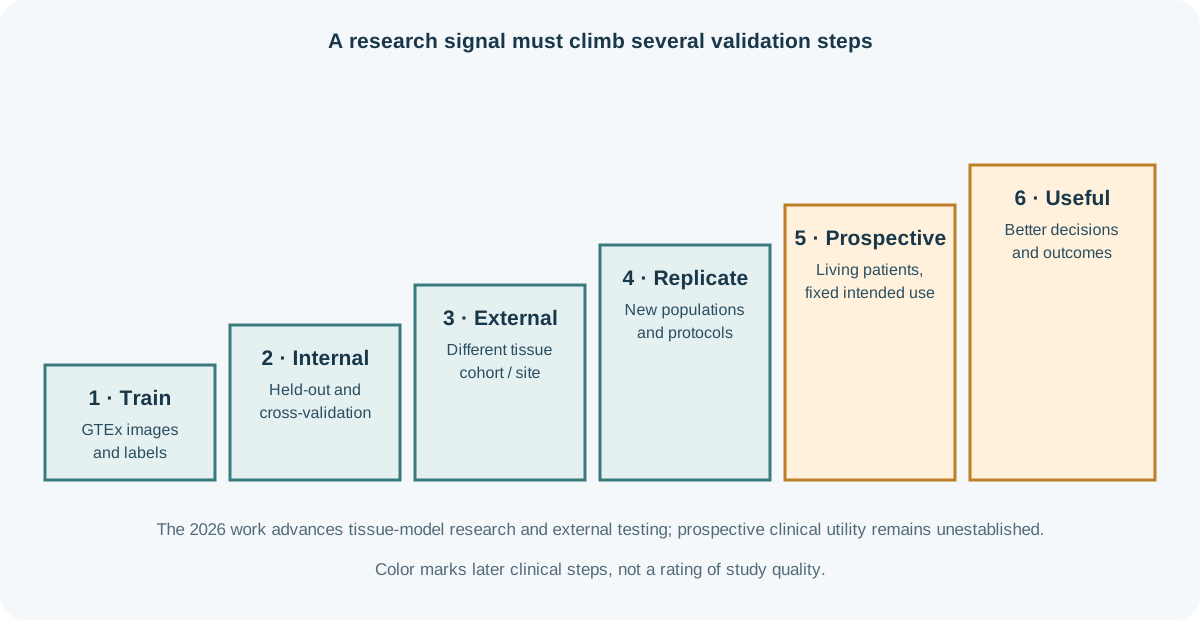
A checklist for the next tissue-clock headline
- Name the sample: living biopsy, post-mortem tissue, blood or another specimen?
- Check the denominator: people, tissues, slides and images are not the same unit.
- Separate prediction from cause: an age-associated image pattern does not identify a mechanism or a treatment target.
- Look for external calibration: were independent sites, scanners and populations tested?
- Ask what decision changes: prospective validation and improved outcomes are needed before a score can guide care.
For wider context, compare this work with organ-specific biological-age measures and the limits discussed in biological-age testing. The Research hub and Biomarkers hub explain how we separate research signals from validated clinical measures.